The increase in market volatility earlier this year was, by most measures, amongst the most significant and dramatic we’ve witnessed for a while. The generally subdued and benign market environment of 2017 was brought to an abrupt end by what some commentators referred to as the ‘February funk’. Whatever you choose to call it, the turbulence wiped an estimated $4 trillion off the value of world stocks.
Predictably enough, the financial media was full of apocalyptic headlines and instant emotional reactions. We as investors are only human and it can be natural to want to respond in some way to news of such a dramatic global market drop played out over such a short space of time. This is why it is important to have an investment plan in place to guide investment decisions and activity whatever the markets throw at us.
We all enter the sphere of investing knowing that volatility is a normal part of the process, so making sure we are prepared for it is a no-brainer. For long-term investors, reacting emotionally to volatile markets may be more detrimental to portfolio performance than the drawdown itself. As an investment manager, it’s my job to agree on a strategy with clients and encourage them to stick to it when the waters get choppy.
Taking the Long View
In times of turbulence it can be helpful to look to the history books to provide some perspective. The graph below shows the calendar year returns for the US stock market, the world’s biggest, since 1979, as well as the largest intra-year declines that occurred during the given years. During this period, the average intra-year decline was around 14%. About half of the years observed had declines of more than 10%, and around a third had declines of more than 15%. Despite substantial intra-year drops, calendar year returns were positive in 32 years out of the 37 examined. This shows both just how common market declines are and how difficult it is to say whether a large intra-year decline will result in negative returns over the entire year.
US Market Intra-Year Gains and Declines vs. Calendar Year Returns, 1979–2017
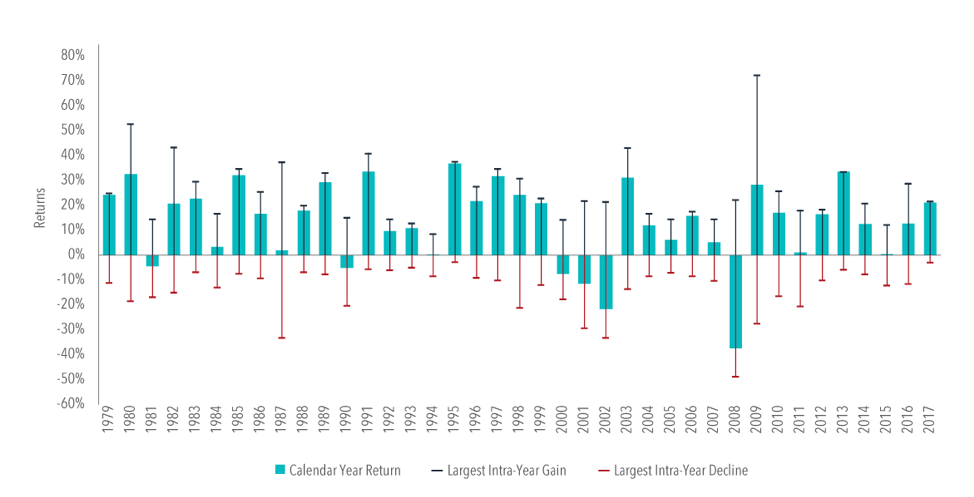
In US dollars. US Market is measured by the Russell 3000 Index. Largest Intra-Year Gain refers to the largest market increase from trough to peak during the year. Largest Intra-Year Decline refers to the largest market decrease from peak to trough during the year. Frank Russell Company is the source and owner of the trademarks, service marks, and copyrights related to the Russell Indexes. Past performance is not a guarantee of future results.
A Matter of Time?
The reaction of some investors to volatility is to consider whether it’s possible to time their entry into the market to avoid the potential losses associated with periods of increased volatility, with the aim of aiding the long-term performance of their portfolios. The answer to this is that it is unlikely that investors can successfully time the market around these periods of turbulence, and in instances where it has been achieved, it may be a result of luck rather than skill.
It’s also worth noting that a substantial proportion of the total return of stocks over long periods of investing is derived from just a handful of days in those periods. As with predicting periods of turbulence, investors are unlikely to be able to identify in advance which days will have strong returns and which will not. Faced with this scenario, the prudent course of action is to remain invested during periods of volatility rather than jump in and out of stocks, otherwise an investor runs the risk of being on the sidelines on days when returns happen to be strongly positive.
A further graph, below, helps to illustrate this point. It shows the annualised compound return of the S&P 500 Index going back to 1990 and illustrates the impact of missing out on just a few days of those strong returns. The bars represent the hypothetical growth of $1,000 over the period and show what would happen if you missed the best single day or a handful of the best single days. during the period. The data shows that being on the sidelines for only a few of the best single days in the market would have resulted in substantially lower returns than the total period had to offer.
Performance of the S&P 500 Index, 1990–2017
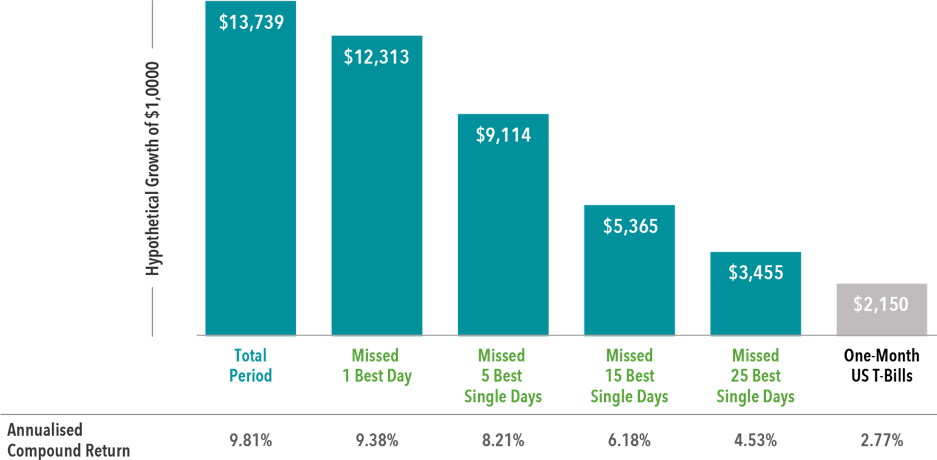
In US dollars. For illustrative purposes. The missed best day(s) examples assume that the hypothetical portfolio fully divested its holdings at the end of the day before the missed best day(s), held cash for the missed best day(s), and reinvested the entire portfolio in the S&P 500 at the end of the missed best day(s). Annualised returns for the missed best day(s) were calculated by substituting actual returns for the missed best day(s) with zero. S&P data © 2018 S&P Dow Jones Indices LLC, a division of S&P Global. All rights reserved. One-Month US T- Bills is the IA SBBI US 30 Day TBill TR USD, provided by Ibbotson Associates via Morningstar Direct. Data is calculated off rounded daily index values. Past performance is not a guarantee of future results.
Sticking to the Knitting…
While the market volatility of earlier this month created some shockwaves and grabbed the headlines, the key is having a process and sticking to it – or ‘sticking to the knitting’ as we would say. It is important that investors understand why the process works when it is working and, when it doesn’t, why this is also the case. This gives investors peace of mind when encountering volatility that it’s not the end of the world, that the strategy can absorb it and offers some perspective in times of market turbulence.
If you would like to discuss your investment management needs, please contact us, we’d be happy to talk through your plans.
—
This article does not constitute investment advice. Individuals must not rely on this information to make a financial or investment decision. Before making any decision, we recommend you consult your Investment Manager to take into account your particular investment objectives, financial situation and individual needs. Past performance is not a guide to future performance. The value of an investment and the income from it may go down as well as up and investors may not get back the amount originally invested, therefore your capital is always at risk.